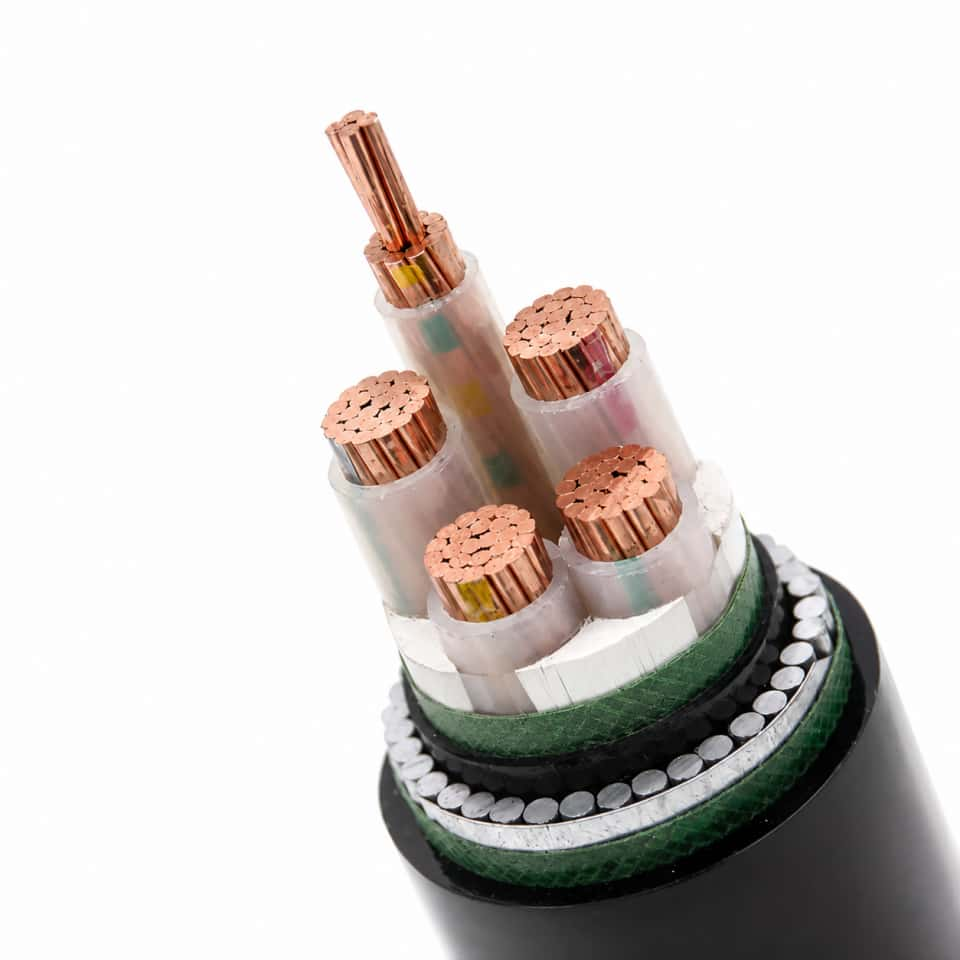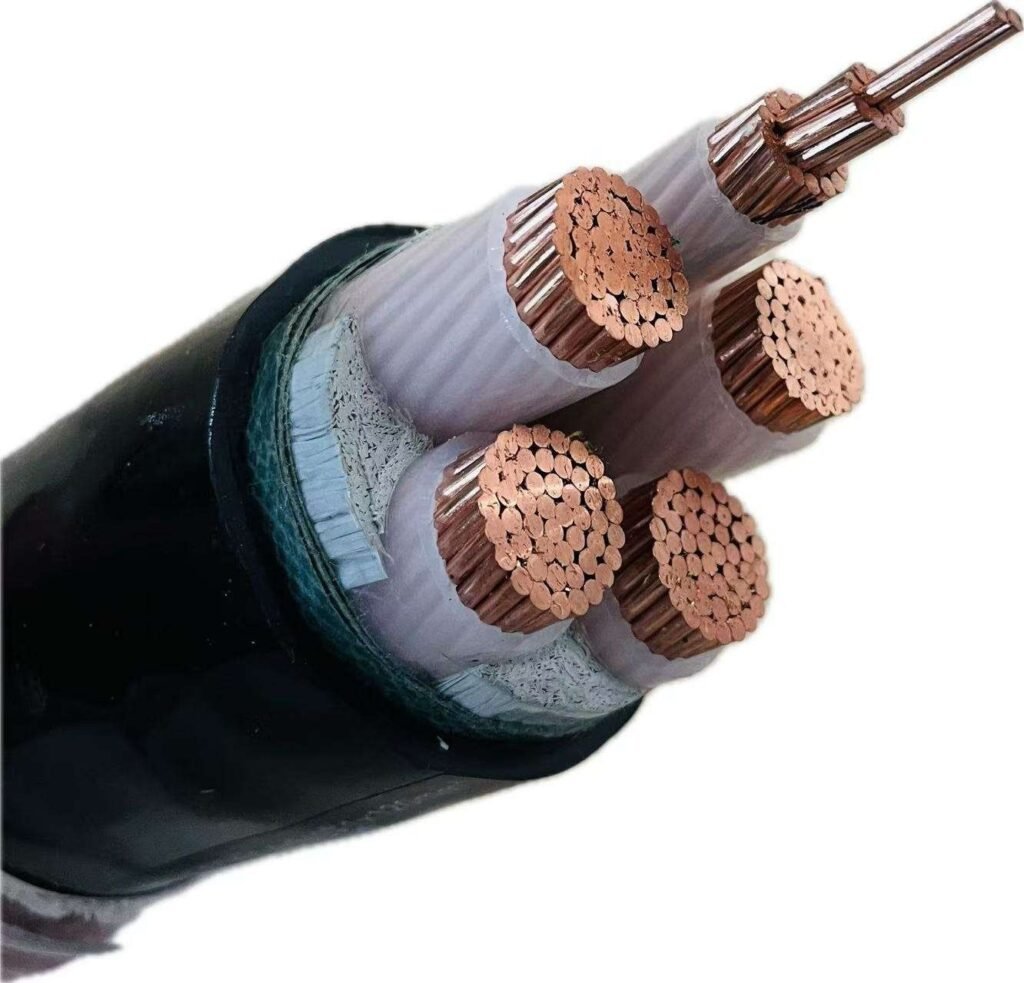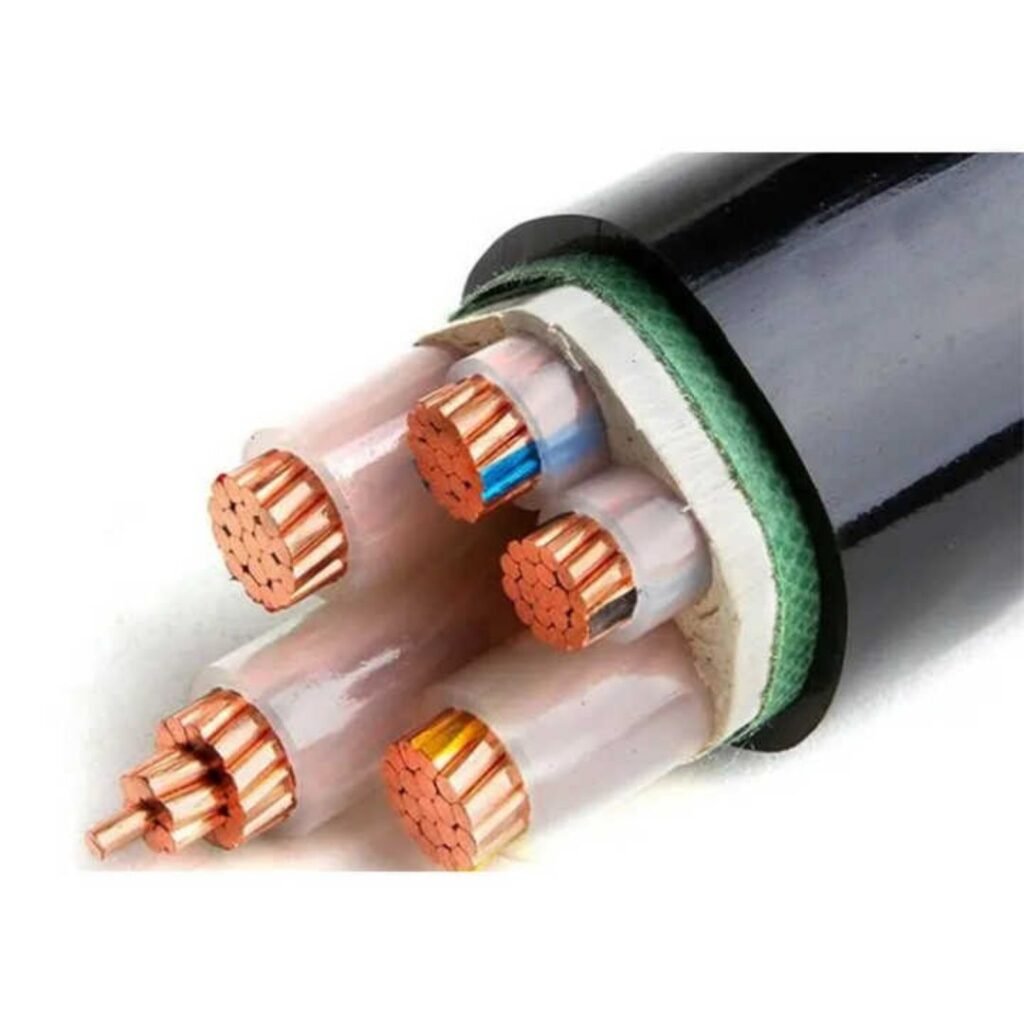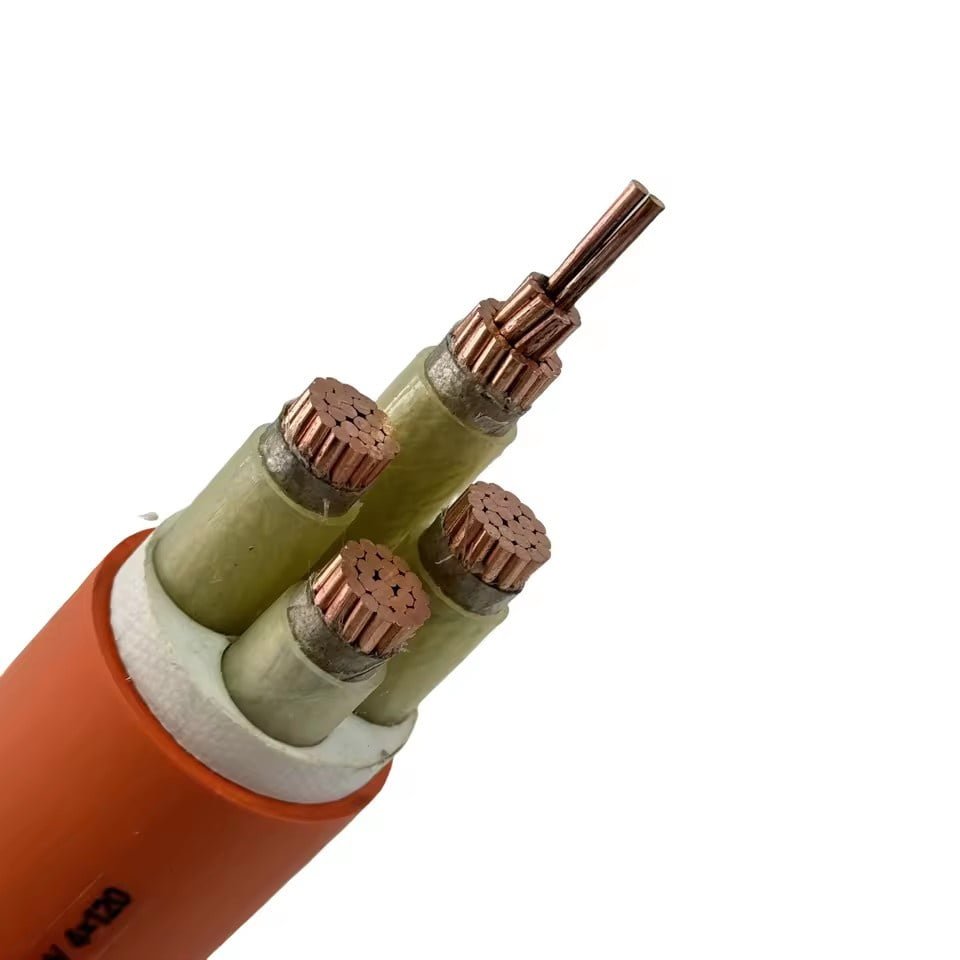
Low voltage on a wire you know is energized is one of those faults that can burn an afternoon and still leave you guessing. Motors run sluggish or trip on thermal overload. PLC inputs float in a gray zone and behave unpredictably. Lighting dims just enough that someone notices but not enough that a quick meter check feels conclusive. The longer it goes undiagnosed, the worse it compounds — undersized conductors running hot accelerate insulation aging, loose terminations arc and pit, and a 6% voltage sag on a three-phase motor can quietly cost you 12–15% extra energy over a full shift. None of that shows up on a single invoice line; it just bleeds.
A wire shows low voltage because something between the source and the load is consuming voltage that was never meant to be consumed there. The usual culprits are excessive conductor resistance from undersized or overly long wire runs, high-resistance connections at terminations or splices, overloaded circuits drawing more current than the wiring was sized for, or a supply-side problem — weak transformer regulation, shared neutral overloading, or upstream feeder drop — that compounds by the time the signal reaches your measurement point.
What makes this genuinely tricky is that most of those causes look almost identical on a multimeter. You read 108 V where you expect 120 V, and the meter doesn’t tell you whether the problem is 30 meters of undersized wire, a corroded lug in a junction box three bays over, or a transformer that’s been running 8% low since last winter. Working through it systematically — understanding what each mechanism actually does to the voltage, and why — is the only way to stop replacing parts that aren’t broken.
Ohm’s Law and Voltage Drop: The Physics Behind Every Low-Voltage Complaint
Every low-voltage complaint on a plant floor traces back to the same uncomfortable truth: wire is not a perfect conductor. It has resistance, and resistance under load means voltage drop. No exceptions.
Ohm’s Law states it plainly — V = I × R. The voltage drop across any conductor equals the current through it multiplied by its resistance. A 2.5 mm² copper wire running 50 meters to a panel endpoint isn’t a zero-resistance ideal; it’s a small but real resistor sitting in series with your load. Push 20 A through it and you will see a measurable voltage difference between the source end and the load end. That difference is energy dissipated as heat in the conductor, unavailable to do useful work.
The Practical Formula and What Each Variable Actually Controls
For single-phase circuits, the working formula is:
VD = (2 × L × R × I) / 1000
where L is the one-way cable length in meters, R is the conductor resistance in Ω/km, and I is the load current in amperes. The factor of 2 accounts for current traveling out through the line conductor and returning through the neutral — both runs contribute resistance.
Walk through a realistic example. A 50 m run of 2.5 mm² copper cable: standard resistance for that conductor is roughly 7.4 Ω/km at 20 °C, derived from copper’s resistivity of 1.72 × 10⁻⁸ Ω·m. Load current is 20 A.
VD = (2 × 50 × 7.4 × 20) / 1000 = 14.8 V
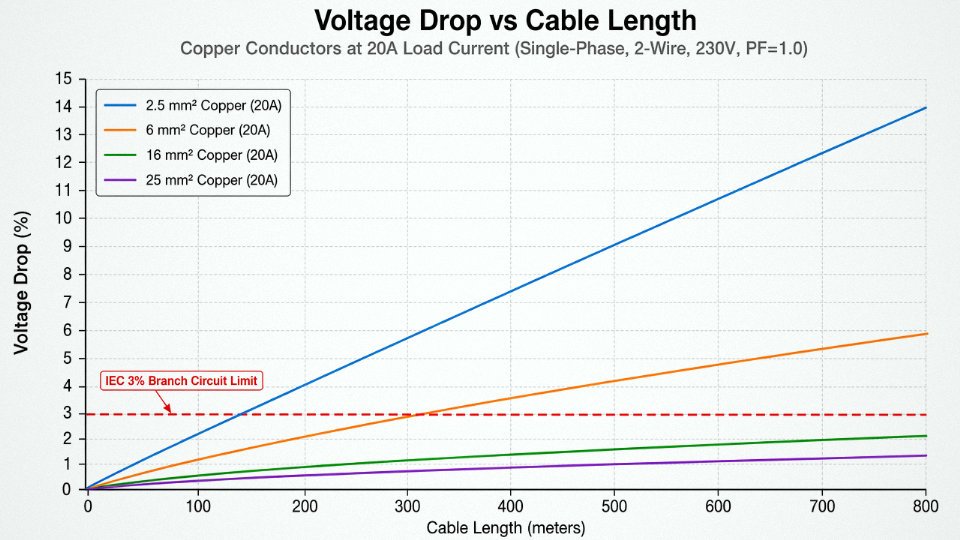
On a 230 V supply that’s a 6.4% drop — roughly double the IEC-recommended 3% ceiling for branch circuits.
IEC standards recommend a maximum voltage drop of 3% for branch circuits and 5% cumulative across feeder plus branch circuit in most building wiring applicationsTrue
This aligns with IEC 60364-5-52 guidance and mirrors NEC recommendations; the 3%/5% split is widely referenced in installation design practice globally.
At 6.4% drop, a 230 V motor nominally rated for that supply is actually seeing around 215 V. Torque falls off as the square of voltage. Starting current spikes harder, insulation runs hotter, and service life shortens measurably. In practice, that motor will trip thermal protection more frequently — and the maintenance crew usually blames the motor, not the undersized cable that’s been there since commissioning.
Power Factor and Why Pure DC Calculations Underestimate Real Drop
For AC circuits — which is most of what you’re dealing with — the story gets slightly more complicated. Conductors don’t just have resistance; they have inductive reactance, which increases with frequency and cable length. The total opposition to current flow is impedance (Z), combining resistance and reactance in a vector relationship. On a circuit feeding resistive loads like heaters, the difference between using resistance alone versus full impedance is small, often under 2%. On motor circuits, especially large induction motors with power factors in the 0.7–0.85 range under partial load, reactive impedance can push actual voltage drop 10–15% higher than a simple DC resistance calculation suggests. Size motor branch circuits using impedance, not just resistance. This is where a lot of quick estimates go wrong.
How Current Load Scales the Problem
The drop doesn’t scale cleanly with current in a system sense, even though the formula is linear, because higher currents also raise conductor temperature, which raises resistance further. Here’s the direct comparison for the same 50 m, 2.5 mm² copper run:
| Load Current | Calculated VD (V) | Drop on 230 V (%) | IEC 3% Threshold Met? |
|---|---|---|---|
| 10 A | 7.4 V | 3.2% | Marginal — borderline fail |
| 20 A | 14.8 V | 6.4% | No |
| 40 A | 29.6 V | 12.9% | No — significant risk |
At 40 A this cable isn’t just undersized for voltage drop; it’s a fire and insulation-degradation concern. The rating of 2.5 mm² copper is typically 20–27 A depending on installation method and ambient temperature — running 40 A through it is a separate violation before you even discuss the 12.9% voltage drop.
What the table illustrates practically: a cable that was “acceptable” at original commissioning load becomes a real problem when production expands and someone adds a second machine on the same run three years later. Voltage drop scales with load. Systems rarely stay at their original design current.
Seven Root Causes That Make a Wire Carry Low Voltage
Low voltage at a load terminal is rarely caused by just one thing, and chasing the wrong cause wastes shift time fast. Here are the seven fault categories worth working through systematically.
Undersized Conductor Cross-Section
This is the most common cause on fast-track construction sites, and it’s almost always a procurement or design-review failure, not a field wiring mistake. A contractor specs 16 mm² to save cost or because the initial load schedule was optimistic; the actual connected load at commissioning runs closer to what a 25 mm² was sized for. The result is chronic, load-dependent voltage drop that’s worst during shift peaks and nearly invisible during walk-down inspections. With copper at roughly 1.15 Ω/km for 16 mm², a 150 m run at 80 A already puts you at around 2.8 V drop one-way — getting uncomfortable before you’ve added any connection losses.
Excessive Circuit Length Without Compensation
Mining hauls, offshore platform cable trays, and large petrochemical campuses routinely see single cable runs of 400–800 m between distribution boards and remote loads. Designers sometimes check ampacity and forget to run the voltage drop calculation for the actual installed length. Cumulative resistance over that distance compounds quickly, especially at full load, and the problem gets worse in summer when ambient temperature in cable trays can push conductor temperatures 10–15 °C above the design assumption.
Poor or Corroded Connections and Joints
Contact resistance at a single bad crimp or corroded terminal block can add 0.1–0.5 Ω. Put five of those in series — through a junction box, two intermediate splices, a panel terminal, and a motor termination — and you’ve added more resistance than 100 m of properly sized cable. In practice, this shows up as a load that measures fine at the panel but reads 8–12 V low at the motor. Always measure at the actual load, not at the breaker output. Aluminum-to-copper joints without proper bimetallic lugs are a particularly reliable source of this problem.
Five poorly crimped or corroded joints in series can introduce more total resistance than 100 meters of correctly sized copper conductor.True
At 0.2 Ω per bad joint average, five joints add 1.0 Ω. A 25 mm² copper conductor at roughly 0.727 Ω/km contributes only 0.073 Ω per 100 m, so the joint losses dwarf the cable resistance.
Conductor Material Mismatch or Substandard Purity
Aluminum carries about 56% more resistance per unit cross-section than copper at equivalent purity. If aluminum cable was substituted for specified copper — quietly, during procurement — the installed circuit will show persistent voltage drop that no amount of connection cleaning will fix. Less obvious is copper with elevated impurity content, which pushes resistivity meaningfully above the 1.72 × 10⁻⁸ Ω·m benchmark. This is a real quality-control variable, not a theoretical one, and it’s where cable manufacturer standards and third-party material certification actually matter.
Cable Damage, Partial Insulation Breakdown, or Moisture Ingress
A mechanically nicked cable or one with insulation degraded by UV, chemical exposure, or crushing doesn’t fail cleanly — it develops leakage paths that bleed current sideways. Moisture inside the insulation raises capacitive leakage on AC circuits and can create a measurable voltage reduction under load. The tricky part is that the conductor resistance itself looks normal with a cold resistance test; you need to load the circuit and measure under current to see the symptom.
Overloading and Thermal Degradation
Copper’s resistance rises with temperature at roughly 0.00393 per °C. A conductor running 30 °C above its rated operating temperature — not unusual in an overloaded tray — sees its resistance climb around 12%. That increases voltage drop, which at the same load current increases heat further. It’s a self-reinforcing cycle, and it’s why an overloaded circuit that “seemed fine last year” suddenly causes motor trips in summer when ambient temperatures are highest.
Source-Side Deficiencies
Sometimes the wire is perfectly fine and the problem is upstream. Utility voltage sag during grid peak hours, transformer regulation drooping under heavy load, a long medium-voltage feeder with inadequate conductor sizing, or a generator with poor automatic voltage regulator tuning — all of these produce low voltage at every load on the affected circuit simultaneously. The diagnostic tell: if multiple circuits on the same feeder all show low voltage at the same time of day, look upstream before pulling wire.
How Conductor Material, Cross-Section, and Stranding Affect Voltage at the Load End
Every low-voltage complaint that traces back to the cable itself — rather than a loose termination or an undersized transformer — was, in most cases, a procurement or specification decision made months or years before anyone noticed the problem. The wire was ordered, installed, and energized. The voltage drop showed up later, usually when load increased or the ambient temperature climbed in summer.
Copper vs. Aluminum: Resistivity Is Not Just a Number
Copper’s resistivity sits at roughly 1.72 × 10⁻⁸ Ω·m at 20 °C. Aluminum runs about 2.65 × 10⁻⁸ Ω·m — meaning for a given cross-section and run length, an aluminum conductor produces approximately 56% more resistive voltage drop than copper under identical load current. To match copper’s performance, aluminum needs a cross-sectional area roughly 56% larger. In practice, that usually means stepping up one or two standard IEC sizes: a 50 mm² copper feeder becomes a 70 or 95 mm² aluminum equivalent, depending on the exact installation conditions.
That larger cross-section costs money and adds weight, which is why aluminum’s economics only really work on long overhead distribution runs — 100 m or more, in open air, where the thermal derating penalty is low and the weight of copper would require more expensive support structures. In conduit, in cable trays with bundled circuits, or anywhere termination quality is hard to control, aluminum creates compounding problems. Aluminum oxidizes quickly; aluminum oxide is a semiconductor, not a conductor, and a poorly torqued aluminum lug in an industrial panel will show voltage drop at the connection alone that looks like a cable problem. Always use anti-oxidant compound and rated compression lugs, and re-torque on a schedule. This is not optional.
Cross-Section Selection: Ampacity Is Only Half the Job
A cable sized purely for ampacity — the maximum current it can carry without overheating — will still fail the voltage-drop requirement on a long run. The methodology has to address both simultaneously. Start with load current, apply IEC 60364-5-52 or NEC 310 derating factors for ambient temperature (a cable in a 50 °C ambient can lose 20–30% of its rated ampacity compared to the standard 30 °C reference), apply bundling correction factors if multiple cables share a tray or conduit, and arrive at a derated ampacity-compliant cross-section. Then run the voltage drop calculation using VD = (2 × L × R × I) / 1000 with the conductor resistance at operating temperature — not at 20 °C, because resistance climbs roughly 0.4% per °C for copper.
NEC and IEC both recommend keeping branch circuit voltage drop under 3% and cumulative feeder-plus-branch drop under 5%. On a 230 V system, 5% is only 11.5 V. On a long feeder feeding a motor at full load, that margin disappears faster than most specifiers expect. In my experience, the runs that consistently cause trouble are in the 80–150 m range — long enough for drop to matter, short enough that engineers assume the standard ampacity table is sufficient without checking.
Sizing a conductor for ampacity alone is sufficient to prevent voltage drop problemsFalse
Ampacity determines thermal safety, not voltage drop. A conductor can be thermally safe while delivering voltage well below acceptable limits, especially on runs longer than 50–80 m at moderate-to-high load currents. Both criteria must be verified independently.
Stranding Class and AC Resistance
This one gets overlooked. IEC 60228 defines conductor classes: Class 1 is solid, Class 2 is stranded for fixed installation, and Class 5 is fine-stranded for flexible applications. For cables up to about 35 mm², the difference in resistance between classes is negligible. Above 50 mm² at 50 or 60 Hz, skin effect starts to matter. Fine-stranded Class 5 conductors have a slightly higher effective AC resistance than a Class 2 conductor of the same nominal cross-section, because the individual strands are not transposed and current distribution is uneven. The difference is usually small — a few percent — but on a 240 mm² cable in a high-current busway application, a few percent of resistance means real voltage drop and real heat.
For most industrial fixed wiring, Class 2 is the right choice and the one IEC installation standards assume. Use Class 5 where flexibility genuinely matters — trailing cables, machine tool connections, portable equipment. Don’t specify fine-stranded conductor for a buried feeder run just because it’s easier to pull; you’re paying more and getting slightly worse electrical performance.
Manufacturing Standards and Conductor Purity
IEC 60228 sets maximum resistance limits by conductor class and cross-section, and these limits are tighter than they look. A 4 mm² Class 2 copper conductor must not exceed 4.95 Ω/km at 20 °C. Exceed that — because the alloy grade is slightly off, the drawing process introduced work hardening, or the cross-section is nominally labeled but actually undersized — and every voltage drop calculation the specifier ran during design is wrong before the first circuit is energized.
This is where manufacturer compliance actually matters in a practical, measurable sense. A manufacturer like Jinda, working to IEC 60228 and verifying conductor resistance on outgoing product, delivers cable where the resistance values match what the design assumed. A non-compliant conductor might measure 5.4 or 5.8 Ω/km — 10 to 17% higher than spec — and that error accumulates over every meter of the run. On a 200 m feeder at full load, the extra voltage drop from that resistance error alone can push an installation that was designed to sit at 4.2% cumulative drop right past the 5% limit, with no easy fix once the cable is in the ground.
Step-by-Step Field Diagnosis: How to Locate the Source of Low Voltage in an Installed Cable
Low voltage complaints arrive at the maintenance desk in two flavors: sudden and gradual. Sudden drops usually point to a blown connection or a new load that overwhelmed an undersized circuit. Gradual ones — the motor that used to start fine but now struggles every summer — are almost always a slow deterioration problem. The six-step sequence below works for both, and it’s designed so you can run it with instruments a competent site electrician already carries.
Step 1 — Measure Source and Load Simultaneously Under Full Load
This is the only measurement that tells you whether the problem lives in the supply or in the cable run. Put one voltmeter at the breaker output terminals in the panel and another at the load terminals — motor contactor, panel board, whatever the endpoint is — with the circuit carrying its normal operating current. If source reads nominal and load reads low, the voltage is being consumed in the conductor or its connections. If both readings are uniformly low, the issue is upstream: weak supply voltage, transformer tap setting, or a heavily loaded feeder. Don’t run this test at no-load; a lightly loaded cable can look perfectly healthy and still fail the moment the machine starts.
Step 2 — Record Actual Load Current and Check Against Ampacity
Clamp a true-RMS clamp meter around each phase conductor and note the reading during peak operation — not standby, not startup transient, but steady-state running current. Compare it against the cable’s rated ampacity, then mentally adjust for conditions. On a 40 °C ambient day with the cable bundled in a tray with five other loaded circuits, a cable nominally rated at 100 A might be operating safely only to about 65–70 A depending on derating factors. If measured current is above roughly 80% of the derated ampacity, the conductor is running hotter than its design temperature, resistance has climbed, and voltage drop has climbed with it. This is the mechanism behind the “summer problem” pattern that confuses a lot of people — the cable was borderline at installation and seasonal temperature pushed it over the edge.
Step 3 — Measure Resistance at Every Connection Point
A low-resistance ohmmeter (DLRO, or a Ducter-type instrument) is non-negotiable here. Crimp lugs, compression joints, terminal blocks, and bus connections all develop resistance over time through oxidation, fretting, or just a bad original crimp. Any individual connection reading above roughly 1 mΩ deserves re-termination. That sounds trivially small, but a 5 mΩ joint carrying 200 A is dissipating 0.2 W — enough to discolor insulation over months and drive a measurable voltage drop on its own. Check every joint in the circuit, not just the ones that look suspicious. In practice, corroded aluminum terminations in older industrial panels are the most frequent offenders.

Step 4 — Insulation Resistance Test
Apply 500 V DC with a Megger (or equivalent insulation tester) between each conductor and earth, with the load disconnected. For LV cables in service, values below about 1 MΩ/km suggest moisture ingress, physical insulation damage, or partial breakdown from thermal aging. A cable with compromised insulation doesn’t just create a shock hazard — it leaks current to ground continuously, which shows up at the load end as apparent voltage drop under load. Cold, damp conditions after winter shutdowns tend to expose this; a cable that tests marginally in January sometimes recovers to deceptive readings by midsummer.
Insulation resistance values below 1 MΩ/km on a low-voltage cable indicate insulation compromise that can cause measurable leakage current and contribute to apparent voltage drop at the load.True
Partial insulation breakdown creates a resistive leakage path to ground. Under load, this diverts current away from the intended load path and reduces the effective voltage delivered, independent of conductor resistance. IEC 60502 and general LV cable test practices use 1 MΩ/km as a practical minimum threshold for serviceable insulation.
Step 5 — Infrared Thermal Scan Along the Cable Route
An infrared camera run while the circuit is loaded under normal operating conditions will reveal hotspots that a multimeter cannot find. Any point on the cable surface running more than roughly 10 °C above the surrounding cable temperature indicates elevated resistance at that location — a bad joint, a kink that has crushed some conductors, a section buried under thermal insulation that someone added during a building retrofit. Scan junction boxes especially; they concentrate multiple connection points in one place and are frequently overlooked during routine maintenance. This step is quick if you already own the camera, and it occasionally finds damage that would have caused a fire within another season.
Step 6 — Cross-Reference Installed Cable Against Design Specification
Pull the original design drawings and compare conductor material, cross-section, and total circuit length against what is physically installed. This step sounds administrative rather than diagnostic, but substitutions made during procurement or installation — a 10 mm² aluminum run where 10 mm² copper was specified, or a 60-meter total run that somehow became 85 meters due to rerouting — are a surprisingly common root cause of chronic low-voltage problems that survive every other test. Aluminum’s resistivity is about 56% higher than copper for the same cross-section, so a like-for-like material swap without resizing the conductor builds a voltage drop penalty directly into the installation from day one. Check the cable drum labels or any installed marking tags against the specification before assuming the design itself was flawed.
Voltage Drop Standards, Compliance Thresholds, and What Happens When You Exceed Them
The rules governing how much voltage a cable is allowed to lose in transit are not uniform across borders, and if you’re specifying cables for an international project, you’ll need to satisfy more than one framework simultaneously. Getting this wrong at the design stage is expensive — upsizing conductors during commissioning or, worse, after equipment warranties have been voided, costs multiples of what a correct initial specification would have.
IEC 60364-5-52: The Global Baseline
IEC 60364-5-52 is the reference most of the world defaults to when there’s no stronger national standard in play. Its recommendation is straightforward: from the origin of the installation to any socket outlet or fixed current-using equipment, voltage drop under normal service conditions should not exceed 3% for lighting circuits and 5% for other uses (motors, heating, general power). Note the word recommendation — IEC 60364 is a guideline document, and individual countries adopting it (often as their national annex) may tighten or relax those limits. In practice, 5% is the ceiling most engineers treat as a hard constraint because that’s what equipment manufacturers write into their specs.
NEC Article 210 and 215: Recommendations With Real Teeth
The National Electrical Code handles this differently. The voltage drop limits in Articles 210 and 215 appear as informational notes, not mandatory code language — so strictly speaking, a US installation with 8% voltage drop at the load end isn’t a code violation in most jurisdictions. But that distinction barely matters in practice. Motor manufacturers routinely state in their warranty documentation that terminal voltage must remain within ±10% of nameplate rating; many specify ±5%. If you’ve designed a branch circuit with 4% drop and the supply voltage is already running 3% low (common in industrial parks with heavy shared loading), you’re sitting right at the edge before the motor has even run warm. The NEC’s implied target of 3% maximum on branch circuits and 2% on feeders — combined 5% — exists because engineers who ignored it kept burning up equipment and losing warranty claims.
BS 7671 Table 4Ab: Millivolts Per Ampere Per Meter
The UK approach under BS 7671 (IET Wiring Regulations, 18th Edition) expresses voltage drop limits in millivolts per ampere per meter (mV/A/m), tabulated by conductor size and installation method. This makes cable scheduling arithmetic fast: you multiply the table value by the design current and the one-way circuit length, divide by 1,000, and check against the permitted drop in volts. Engineers comfortable with percentage-based standards sometimes find this format unfamiliar at first, but the underlying limits are similar — roughly equivalent to the IEC figures once you convert. The conversion isn’t trivial if you’re doing it in your head, but any serious cable scheduling tool handles it automatically.
What Actually Happens When You Exceed the Limits
This is where the numbers become operationally concrete. Motor manufacturers typically void warranties when terminal voltage falls more than 10% below nameplate — and that threshold sounds comfortable until you account for supply variation, cable drop, and connection resistance stacking up together. LED drivers are less forgiving than people expect: efficiency begins degrading measurably below about 90% of rated input voltage, and some cheaper driver designs go into fault-protection mode and simply shut off. In data centers, even a sustained 5% voltage drop across a distribution run can cause a UPS to interpret the condition as a supply anomaly and initiate a transfer event, which counts against the UPS’s transfer cycle life and can trigger brief server interruptions.
NEC voltage drop limits for branch circuits and feeders are mandatory code requirements in all US jurisdictions.False
The NEC voltage drop figures in Articles 210 and 215 are informational notes, not mandatory requirements. Most US jurisdictions have not adopted them as enforceable code language, though equipment warranties and good engineering practice make them effectively binding in most real projects.
Multi-Standard Compliance for International Projects
Projects that cross regulatory zones — a manufacturing facility in Southeast Asia with US-sourced equipment, European safety certification, and Chinese-manufactured cable — require conductor sizing calculations that satisfy every applicable standard simultaneously, not just the loosest one. A cable order placed with a manufacturer like Jinda for international supply often needs conductors certified to IEC, UL, and GB standards at once, and the sizing must clear the most restrictive voltage drop limit among all three. That usually means designing to IEC 60364’s 3% lighting limit as the floor, then checking the result against the NEC combined 5% budget and BS 7671’s mV/A/m table. Whichever standard demands the larger cross-section governs the purchase. Specifying to a single national standard and assuming the others will follow is a shortcut that procurement engineers tend to regret once the equipment is commissioned and the warranty paperwork arrives.
Selecting the Right Cable to Prevent Low Voltage: Sizing, Specification, and Procurement Checklist
By the time a low-voltage fault shows up on the plant floor, the procurement decision that caused it was made months or years earlier. Getting cable selection right upfront is almost always cheaper than diagnosing and reworking an installed system — sometimes by an order of magnitude.
Step 1: Establish Design Load Current with a Growth Margin
Start with your actual connected load, then add 20–25% for future expansion. That range isn’t arbitrary: most industrial facilities add equipment incrementally, and a cable that’s adequate today for a 40 A circuit will be undersized in three years when someone bolts on another conveyor drive. Use the higher end of that margin (25%) for circuits feeding production lines where downtime is expensive and pulling new cable through conduit would require a shutdown. For lighting circuits or low-criticality loads, 20% is usually fine.
Design current, not nameplate current, is your sizing anchor. Account for motor starting currents if you’re feeding inductive loads — a motor drawing 18 A running may pull 90–110 A at startup, which matters for protection device sizing even if it doesn’t drive the voltage drop calculation directly.
Step 2: Derate for Installation Conditions Before You Touch a Cable Table
IEC 60228 ampacity tables assume reference conditions that rarely match a real installation. A 16 mm² copper conductor in free air at 30 °C carries a different continuous current than the same cable bundled with eleven others inside a trunking system at 45 °C ambient — the derated figure can be 40–50% lower, depending on grouping factor and ambient correction combined. Get this wrong and you’re undersizing before you’ve even calculated voltage drop.
In practice, engineers underestimate ambient temperature in summer months, especially in rooftop plant rooms or cable trays near process heat sources. Check seasonal peak temperatures, not annual averages.
Step 3: Calculate Voltage Drop at Design Current
Use the standard formula: VD = (2 × L × R × I) / 1000, where L is one-way cable length in meters, R is conductor resistance in Ω/km from IEC 60228, and I is your design current in amperes. The “2×” accounts for both the live and return conductors.
The table below gives you a ready reference for standard copper cross-sections, their maximum conductor resistance at 20 °C per IEC 60228, and the approximate maximum circuit length to stay within a 3% voltage drop limit at a 20 A continuous load on a 230 V single-phase circuit. Lengths will differ for three-phase or higher supply voltages — recalculate; don’t interpolate blindly.
| Cross-Section (mm²) | Max. Resistance at 20 °C (Ω/km) | Approx. Max. Length at 20 A / 3% drop, 230 V (m) |
|---|---|---|
| 1.5 | 12.1 | ~22 |
| 2.5 | 7.41 | ~36 |
| 4 | 4.61 | ~58 |
| 6 | 3.08 | ~87 |
| 10 | 1.83 | ~146 |
| 16 | 1.15 | ~232 |
| 25 | 0.727 | ~367 |
| 35 | 0.524 | ~509 |
| 50 | 0.387 | ~690 |
| 70 | 0.268 | ~997 |
| 95 | 0.193 | ~1,384 |

Step 4: Exceed the Limit? Step Up One Cross-Section and Recalculate
If your calculated drop is over 3% for a branch circuit (or puts the cumulative feeder-plus-branch total above 5%), move to the next standard cross-section and run the numbers again. One step up is usually sufficient; two steps up is a signal that your run length is genuinely problematic and you should also consider whether the supply point location makes sense.
Don’t split the difference by ordering an intermediate size that isn’t in IEC 60228’s standard series. Non-standard sizes create procurement headaches for replacements and are sometimes a flag that a supplier is offering substandard stock.
Conductor Purity and Actual Cross-Section: What the Purchase Order Must Specify
Here’s something that catches buyers off guard. A cable offered as “16 mm²” may have an actual conductor cross-section of 14.8–15.2 mm², which is permissible under some looser interpretations of manufacturing tolerance but produces measurably higher resistance than the IEC 60228 reference value. Over a 200-meter run at full design current, that gap translates directly into excess voltage drop that your design didn’t account for.
A cable labeled 16 mm² can legally have a conductor area below 16 mm² under some manufacturer tolerances, resulting in resistance higher than the IEC 60228 maximum value.True
IEC 60228 specifies maximum resistance values, not minimum cross-sectional area. A conductor that meets the resistance limit at 20 °C is considered compliant, but some suppliers optimize conductor purity and geometry to the low end of tolerance, leaving performance margin thin. Specifying both conductor resistance per drum and minimum copper purity closes this gap.
Specify a minimum copper purity of 99.9% electrolytic tough pitch (ETP) copper in your purchase order, not just a cross-section. Copper alloyed with even small amounts of impurities has measurably higher resistivity — it can push a “compliant” cable to the edge of its resistance limit before it even leaves the factory.
Procurement Checklist That Actually Reduces Risk
A cable specification sheet attached to a purchase order is not a quality guarantee. These are the verification steps worth enforcing:
- Request the IEC 60228 compliance certificate — and confirm it covers the specific drum lot, not just the cable type.
- Ask for third-party test reports for conductor DC resistance per drum, tested at 20 °C or corrected to 20 °C using a documented temperature coefficient.
- Specify Class 2 (solid or stranded for fixed wiring) or Class 5 (flexible) stranding explicitly. The stranding class affects both flexibility and, marginally, effective conductor packing — which matters at larger cross-sections.
- Confirm copper purity to 99.9% minimum ETP. Some suppliers will substitute copper-clad aluminum (CCA) conductors for short-run cost savings; CCA’s resistivity is substantially higher than solid copper and it will fail your voltage drop budget on longer runs. Request a material certification.
- Require factory acceptance test (FAT) documentation before shipment on orders above a threshold you set based on project criticality — typically anything over a few hundred meters of larger-section cable.
Jinda supports all of the above as standard process for its international supply contracts, including per-drum resistance test reports and third-party inspection coordination.
The Total Cost of Ownership Argument
A 16 mm² cable that costs 12–18% more per meter than a nominally equivalent product from a lower-tier source might add $2,000–4,000 to the material cost of a mid-sized industrial project. That seems significant until you calculate what a chronic voltage drop problem costs: motors running hot and failing early, variable frequency drives tripping on undervoltage faults, production interruptions, and the labor cost of troubleshooting a problem that was never obvious at commissioning. Motor replacement and associated downtime in a continuous-process facility can easily reach $30,000–80,000 per incident, depending on motor size, industry, and how long the fault goes undetected.
Quality cable is risk mitigation, not premium spending. The engineers who’ve learned this the hard way usually learned it during a production shutdown — which is a more expensive classroom than a spec sheet.
Special Scenarios Where Low Voltage in Wiring Is Especially Dangerous or Damaging
Voltage drop is a manageable inconvenience in most commercial lighting circuits. In the following environments, it crosses into territory where the consequences are measured in lost production, equipment failure, regulatory violation, or — in the worst cases — fire and fatalities.
Mining and Tunneling
Underground face equipment — drill jumbos, continuous miners, conveyor drives — is powered through trailing cables that routinely run 500–2,000 m from the surface substation or shaft transformer. At those distances, even a correctly sized cable sees meaningful resistive drop under running current. Under starting conditions, where inrush can be 5–7× full-load current, the instantaneous drop spikes hard.
A 5% drop at the drill motor during a locked-rotor event doesn’t just slow the start. It reduces the motor’s breakdown torque — which falls with the square of terminal voltage — often enough to stall the rotor entirely. A stalled motor in a confined heading draws sustained high current, generates heat, and in a gassy atmosphere that’s not a theoretical concern: it’s precisely the failure mode that IECEx and ATEX certification regimes are designed to eliminate. Those standards carry zero tolerance for unexpected thermal anomalies in Zone 1 and Zone 2 classified areas. If the cable spec was set at the design stage based on a short-circuit calculation alone, without modeling the starting voltage profile, the whole system is quietly non-compliant before the first shift.
In practice, mining engineers often upsize trailing cables by one or two cross-section steps beyond what steady-state calculations require, specifically to preserve enough terminal voltage for reliable motor starting. That extra copper cost at procurement is trivial against the cost of a stalled face and a mandatory incident investigation.
Offshore and Marine Installations
Salt-air environments attack terminal connections continuously. A connector that tests clean on commissioning day develops measurable contact resistance within 12–18 months if it wasn’t properly crimped, sealed, and protected — and on a vessel with thirty such connections in series across multiple decks, the cumulative effect is real. I’ve seen installations where the cable itself was perfectly adequate but the terminal corrosion added the equivalent of an extra 80–100 m of conductor resistance.
IEC 60092 series governs marine cable requirements, including voltage drop limits, but the standard doesn’t manage your maintenance schedule. Combined long runs and degraded terminations can push cumulative drop past 8%, at which point motors and navigation equipment start behaving erratically. On a dynamic positioning vessel, erratic is not acceptable.
IEC 60092 requires marine cables to be halogen-free and flame-retardant in addition to meeting voltage drop limitsTrue
IEC 60092-350 and related parts specify both the electrical performance and fire/smoke behavior requirements for shipboard cable; voltage drop compliance alone is insufficient for type approval.
Solar PV String Wiring
DC systems don’t benefit from transformer step-up between the string and the inverter. Every volt lost in the string wiring is a volt the inverter never sees. A 2% drop across a 1 MW installation represents roughly 20 kW of permanently lost generation capacity — worth somewhere in the range of $1,500–$2,000 per year at typical commercial electricity rates, depending on your tariff and irradiance profile. Over a 25-year asset life, that compounds into a procurement decision that paid for better cable many times over.
IEC 62548 recommends keeping DC string-side voltage drop to 1–3% maximum. The tighter end of that range is worth targeting on high-irradiance sites where strings operate near STC conditions for extended periods.
Data Centers
PDU input voltage must stay within ±5% of nominal under all load conditions, including unbalanced three-phase loading and N+1 UPS failover events. When voltage at the PDU drops toward the low end of that band, redundant UPS modules begin sharing load unequally — the module seeing lower input voltage draws higher current to compensate, which degrades its thermal margin and shortens service life. The fault tolerance the redundancy was designed to provide quietly erodes.
Uptime Institute Tier certification and ASHRAE power path guidelines both require voltage drop analysis as part of the power distribution design documentation. Skipping that calculation during design and hoping for the best is a path toward a Tier rating your data center can’t actually defend under audit.
High-Rise Vertical Risers
This one catches designers who apply horizontal installation ampacity tables to riser cables without adjustment. A 150–300 m vertical run serving floors 50–100 carries the same current as a horizontal equivalent, but the heat stratification profile is different: heat from lower cable sections rises into upper sections, increasing the effective ambient temperature seen by the conductor. That raises resistance slightly and reduces the safe continuous current rating.
The design error is subtle. The fix — applying a derating factor and modeling the vertical thermal gradient — adds maybe two hours of engineering time. Skipping it means the riser operates closer to its thermal limit than the documentation implies, and voltage drop is marginally worse than calculated. In a 400 A riser feeding critical mechanical plant, “marginally worse” matters.
Frequently Asked Questions About Low Voltage in Wires and Cables
Can a wire cause low voltage without any visible damage?
Absolutely, and this catches people off guard more often than it should. An undersized conductor running a long circuit will show chronic low voltage under load with no burn marks, no tripped breaker, no smell — nothing visually wrong. The insulation looks fine, the terminations look fine. The only way you catch it is by measuring voltage at the load end under full operating current, then again with the load disconnected. A gap of more than a few volts between those two readings is your diagnostic. In practice, I’ve seen pumping stations where the voltage at the motor terminals sagged 8–10% under load while the supply voltage at the panel was perfectly normal. Nobody noticed for months because the pump still ran — just inefficiently, with elevated motor temperature.
A wire can cause measurably low voltage at the load without showing any external physical damage.True
Voltage drop from undersized or long conductors is a purely electrical phenomenon driven by resistance and current; the insulation and conductor may be physically intact while still producing significant voltage drop under load.
Does wire length alone cause low voltage?
Yes — if the cross-section isn’t scaled up to compensate. Resistance is proportional to length (R = ρ × L / A), so double the run, double the resistance, roughly double the voltage drop at the same current draw. Engineers sometimes spec a cable size correctly for the load but forget that the circuit is 180 meters of one-way run rather than 60. That’s the sort of thing that slips through on fast-moving procurement, especially when panel locations shift late in a project.
Is aluminum wire more prone to low voltage problems than copper?
Generally, yes, for two reasons. Aluminum’s resistivity (roughly 2.65 × 10⁻⁸ Ω·m) runs about 56% higher than copper’s (1.72 × 10⁻⁸ Ω·m), so you need meaningfully larger cross-section to carry the same current at equivalent voltage drop. The second issue is oxide formation at terminations — aluminum oxidizes quickly on exposed surfaces, and that thin oxide layer is resistive. If the connections aren’t made with proper anti-oxidant compound and appropriate lugs, the contact resistance creeps up over time, adding localized voltage drop that your original cable sizing calculation never accounted for. Both problems are manageable with correct specification and installation practice, but they demand more discipline than copper.
How do I fix low voltage in a cable that’s already installed and too small?
You have four realistic options: run a parallel cable alongside the existing one to share the current load (effectively doubling the conductor cross-section without rewiring); replace the cable entirely with a correctly sized one; reduce the connected load on that circuit; or relocate the distribution panel closer to the load to shorten the run. Parallel cables are often the most practical in retrofit situations where pulling a new large cable through an existing conduit isn’t feasible, but confirm the existing termination hardware can handle both cables before committing.
What is the difference between voltage drop and voltage sag?
They feel similar at the load — the equipment sees low voltage — but the causes and fixes are different. Voltage drop is steady-state: it’s there whenever the load is running, caused by cable resistance and current. Voltage sag (or dip) is transient, typically lasting milliseconds to a few seconds, triggered by a large motor starting, a fault clearing somewhere upstream, or a utility disturbance. Measuring with a simple multimeter can miss a sag entirely; catching sags requires a power quality recorder or data logger. Treating a sag problem by upsizing cable won’t help much — you’d address the source, add a soft starter, or use power conditioning equipment instead.
How does temperature affect wire voltage drop?
More than most designers remember to account for. Copper conductor resistance increases at roughly 0.393% per °C above 20 °C. A cable running at 70 °C — a typical rated operating temperature — carries about 20% higher resistance than the 20 °C figure used in most standard tables. That means your actual voltage drop in service is higher than what your room-temperature calculation predicted. For long industrial runs or cables installed in hot environments (inside conduit banks in summer, buried under sun-baked soil, near furnaces), this correction isn’t trivial.
When should I request a factory test report to verify voltage drop performance?
For any critical infrastructure project, long-run industrial installation, offshore application, or renewable energy cable run, always request the conductor DC resistance test report per IEC 60228, covering every drum supplied. This isn’t paranoia — conductor resistance varies with actual cross-sectional area, and a drum that measures slightly under the nominal area will show higher resistance than your design assumed. Getting per-drum traceability before cables are installed means you have documented confirmation that the delivered product matches the voltage drop calculation. Finding out after commissioning that one feeder cable is borderline noncompliant is an expensive conversation nobody wants.